Sierra Leone

| Government | |
| Name | Republic of Sierra Leone |
| Government type | presidential republic |
| Capital | Freetown (853,651 (2004)) |
| Currency | Leone (SLL) |
| Organization | |
| Member State | Commonwealth of Nations |
| People | |
| Population (2020) | 7,976,985 (102nd) |
| Density of population | 97 P/km2 (114th) |
| Nationality | Sierra Leonean |
| Official languages | |
| English | |
| Ethnic groups (2013) | |
| Temne | 35.5% |
| Mende | 33.2% |
| Limba | 6.4% |
| Kono | 4.4% |
| Fullah | 3.4% |
| Loko | 2.9% |
| Koranko | 2.8% |
| Sherbro | 2.6% |
| Mandingo | 2.4% |
| Creole (also known as Krio) | 1.2% |
| other Sierra Leone | 4.7% |
| other foreign | 0.3% |
| unspecified | 0.2% |
| Religions (2013) | |
| Muslim | 78.6% |
| Christian | 20.8% |
| other | 0.3% |
| unspecified | 0.2% |
| Life expectancy (2020) | |
| Male | 57.1 years |
| Female | 62.6 years |
| Total population | 59.8 years (218th) |
| Homicides | |
| Total (2015) | 1.7 per 100,000 people (112th) |
| Geography | |
| Land area | 71,620 km2 |
| water area | 120 km2 |
| total area | 71,740 km2 (120th) |
| Mean elevation | 279 m |
| Lowest point | |
| Atlantic Ocean | 0 m |
| Highest point | |
| Loma Mansa (Bintimani) | 1,948 m |
| Land use (2011) | |
| Agricultural land | 56.2% |
| Arable land | 23.4% |
| Permanent crops | 2.3% |
| Permanent pasture | 30.5% |
| Forest | 37.5% |
| Other | 6.3% |
| Urbanization | |
| Urban population (2020) | 42.9% |
| Rate of urbanization | 3.12% annual rate of change (2015 – 2020) |
| Economy | |
| Labor force (2017) | 2.972 million (105th) |
| Labor force by occupation (2014) | |
| Agriculture | 61.1% |
| Industry | 5.5% |
| Services | 33.4% |
| Unemployment rate (2017) | 15% (172nd) |
| GDP (PPP) (estimate 2018) | |
| Total | $12.177 billion |
| Per capita | $1,608 |
| GDP (nominal) (estimate 2018) | |
| Total | $3.824 billion |
| Per capita | $505 |
| GDP by sector (estimate 2017) | |
| Agriculture | 60.7% |
| Industry | 6.5% |
| Services | 32.9% |
| Exports (2017) | $808.4 million (169th) |
| Exports partners (2017) | |
| Cote d’Ivoire | 37.7% |
| Belgium | 20.5% |
| US | 15.7% |
| China | 10.2% |
| Netherlands | 6.1% |
| Imports (2017) | $1.107 billion (183rd) |
| Imports partners (2017) | |
| China | 11.5% |
| US | 9.2% |
| Belgium | 8.8% |
| UAE | 7.7% |
| India | 7.4% |
| Turkey | 5.2% |
| Senegal | 5.1% |
| Netherlands | 4.3% |
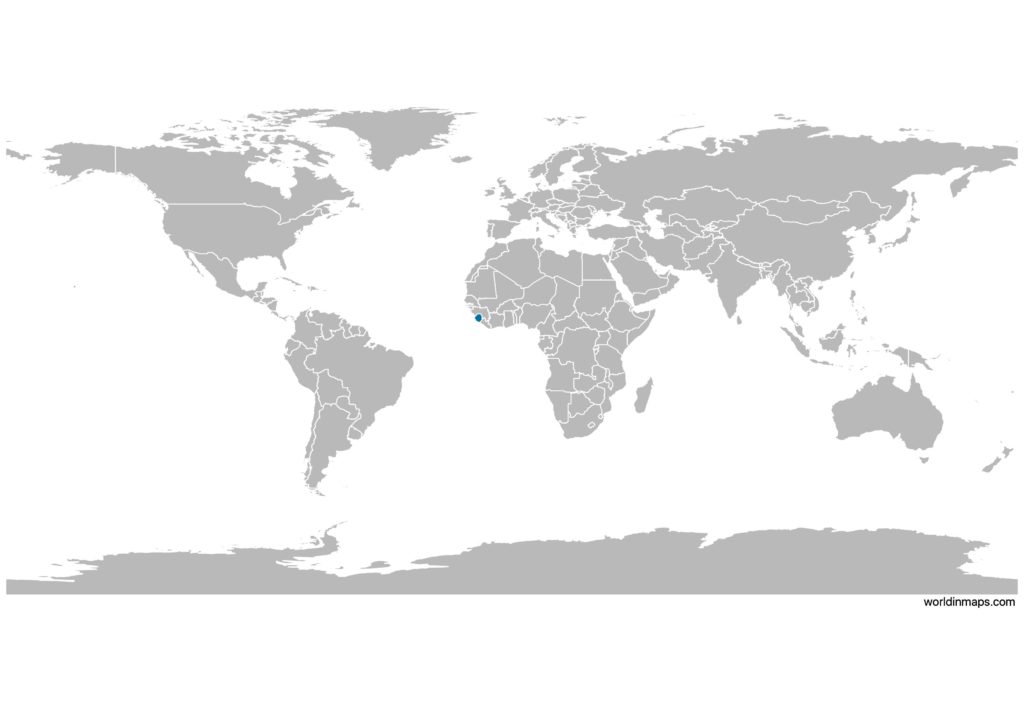
Sierra Leone on the world map
Sierra Leone top 10 largest cities (2004)
- Freetown (853,651)
- Bo (149,957)
- Kenema (128,402)
- Makeni (82,940)
- Koidu (80,025)
- Lunsar (24,450)
- Port Loko (23,195)
- Pandebu-Tokpombu (20,219)
- Kabala (19,074)
- Waterloo (18,579)
Demography
Population pyramid
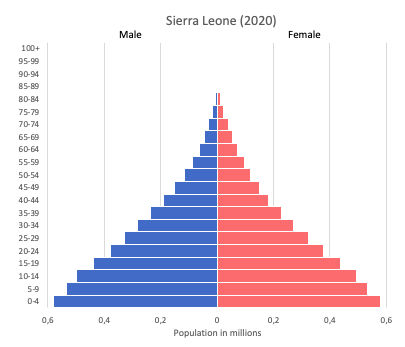
Age structure data
Estimate for 2020:
- 0-14 years: 41.38% (male 1,369,942/female 1,371,537)
- 15-24 years: 18.83% (male 610,396/female 636,880)
- 25-54 years: 32.21% (male 1,020,741/female 1,112,946)
- 55-64 years: 3.89% (male 121,733/female 135,664)
- 65 years and over: 3.7% (male 100,712/female 144,382)
Remark: the age structure of a population affects a nation’s key socioeconomic issues. Countries with young populations (high percentage under age 15) need to invest more in schools, while countries with older populations (high percentage ages 65 and over) need to invest more in the health sector. The age structure can also be used to help predict potential political issues. For example, the rapid growth of a young adult population unable to find employment can lead to unrest.
Population from 1950 to 2020
Source: United Nations, Department of Economic and Social Affairs, Population Division (2019). World Population Prospects 2019, Online Edition. Rev. 1.
Evolution of the life expectancy from 1960 to 2018
Source: World Development Indicators, The World Bank
Major rivers
Economy
Agriculture:
rice, coffee, cocoa, palm kernels, palm oil, peanuts, cashews, poultry, cattle, sheep, pigs, fish
Industries:
diamond mining, iron ore, rutile and bauxite mining, small-scale manufacturing (beverages, textiles, footwear)
Exports – commodities:
iron ore, diamonds, rutile, cocoa, coffee, fish
Imports – commodities:
foodstuffs, machinery and equipment, fuels and lubricants, chemicals
Time zone and current time in Sierra Leone
Go to our interactive map to get the current time in Sierra Leone