Solomon Islands
| Government | |
| Name | Solomon Islands |
| Government type | parliamentary democracy under a constitutional monarchy (a Commonwealth realm) |
| Capital | Honiara (84,520 (2017)) |
| Currency | Solomon Islands dollar (SBD) |
| Organization | |
| Member State | Commonwealth of Nations |
| People | |
| Population (2020) | 686,878 (167th) |
| Density of population | 18.1 P/km2 (200th) |
| Nationality | Solomon Islander |
| Official languages | |
| English | |
| Ethnic groups (2009) | |
| Melanesian | 95.3% |
| Polynesian | 3.1% |
| Micronesian | 1.2% |
| other | 0.3% |
| Religions (2009) | |
| Protestant | 73.4% |
| Church of Melanesia | 31.9% |
| South Sea Evangelical | 17.1% |
| Seventh Day Adventist | 11.7% |
| United Church | 10.1% |
| Christian Fellowship Church | 2.5% |
| Roman Catholic | 19.6% |
| other Christian | 2.9% |
| other | 4% |
| unspecified | 0.1% |
| Life expectancy (2020) | |
| Male | 73.5 years |
| Female | 79 years |
| Total population | 76.2 years (103rd) |
| Homicides | |
| Total (2008) | 3.8 per 100,000 people (76th) |
| Geography | |
| Land area | 27,986 km2 |
| water area | 910 km2 |
| total area | 28,896 km2 (144th) |
| Lowest point | |
| Pacific Ocean | 0 m |
| Highest point | |
| Mount Popomanaseu | 2,335 m |
| Land use (2011) | |
| Agricultural land | 3.9% |
| Arable land | 0.7% |
| Permanent crops | 2.9% |
| Permanent pasture | 0.3% |
| Forest | 78.9% |
| Other | 17.2% |
| Urbanization | |
| Urban population (2020) | 24.7% |
| Rate of urbanization | 3.91% annual rate of change (2015 – 2020) |
| Economy | |
| Labor force (2007) | 202,500 (171st) |
| Labor force by occupation (2000) | |
| Agriculture | 75% |
| Industry | 5% |
| Services | 20% |
| Unemployment rate | NA |
| GDP (PPP) (estimate 2019) | |
| Total | $1.479 billion |
| Per capita | $2,307 |
| GDP (nominal) (estimate 2019) | |
| Total | $1.511 billion |
| Per capita | $2,357 |
| GDP by sector (estimate 2017) | |
| Agriculture | 34.3% |
| Industry | 7.6% |
| Services | 58.1% |
| Exports (2017) | $468.6 million (176th) |
| Exports partners (2017) | |
| China | 64.5% |
| Italy | 6.2% |
| Switzerland | 4.6% |
| Philippines | 4.4% |
| Imports (2017) | $462.1 million (199th) |
| Imports partners (2017) | |
| China | 21.9% |
| Australia | 19.6% |
| Singapore | 10.7% |
| Vietnam | 7.5% |
| NZ | 6.2% |
| Papua New Guinea | 5% |
| South Korea | 4.7% |
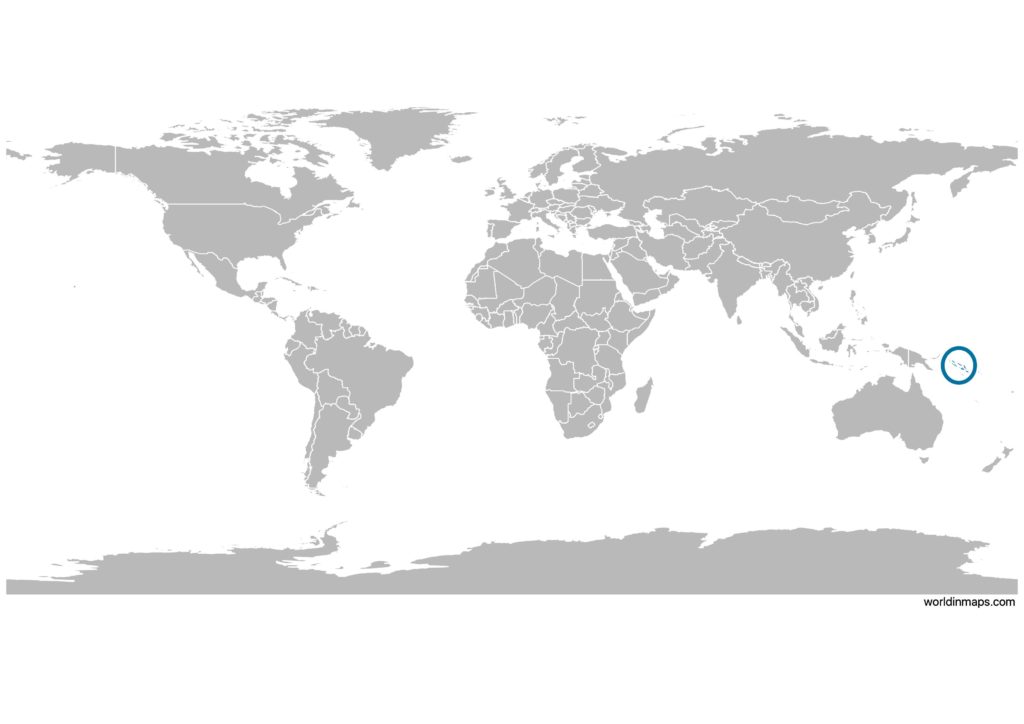
Solomon Islands on the world map
Demography
Population pyramid
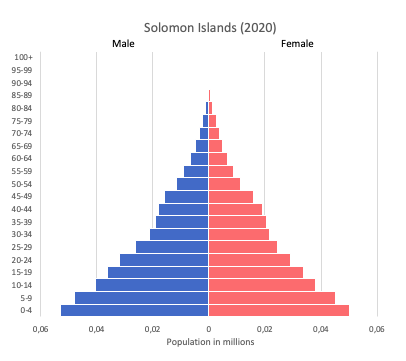
Age structure data
Estimate for 2020:
- 0-14 years: 32.99% (male 116,397/female 109,604)
- 15-24 years: 19.82% (male 69,914/female 65,874)
- 25-54 years: 37.64% (male 131,201/female 126,681)
- 55-64 years: 5.04% (male 17,844/female 16,704)
- 65 years and over: 4.51% (male 14,461/female 16,417)
Remark: the age structure of a population affects a nation’s key socioeconomic issues. Countries with young populations (high percentage under age 15) need to invest more in schools, while countries with older populations (high percentage ages 65 and over) need to invest more in the health sector. The age structure can also be used to help predict potential political issues. For example, the rapid growth of a young adult population unable to find employment can lead to unrest.
Population from 1950 to 2020
Source: United Nations, Department of Economic and Social Affairs, Population Division (2019). World Population Prospects 2019, Online Edition. Rev. 1.
Evolution of the life expectancy from 1960 to 2018
Source: World Development Indicators, The World Bank
Economy
Agriculture:
cocoa, coconuts, palm kernels, rice, fruit, cattle, pigs, fish, timber
Industries:
fish (tuna), mining, timber
Exports – commodities:
timber, fish, copra, palm oil, cocoa, coconut oil
Imports – commodities:
food, plant and equipment, manufactured goods, fuels, chemicals
Time zone and current time in Solomon Islands
Go to our interactive map to get the current time in Solomon Islands