Commodities | Home / Commodities / Iron ore
Iron ore
Iron ore rate
Iron Ore Monthly Price in US Dollars per Dry Metric Ton
Source: The World Bank
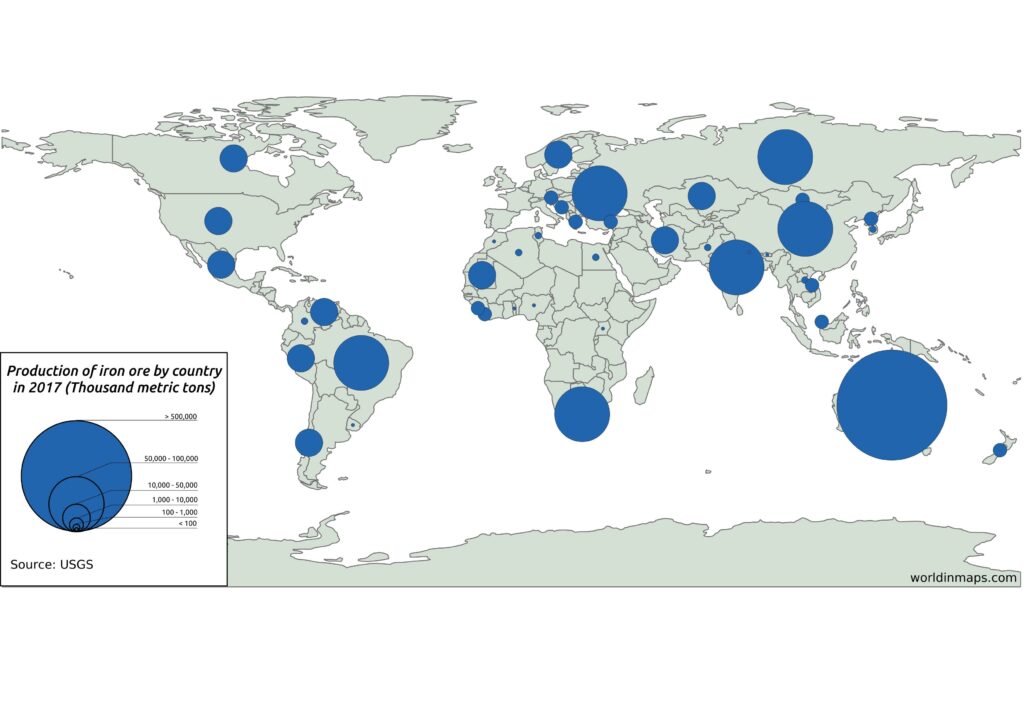
Producers of iron ore in the world
| Rank | Country | Production by country in 2017 (Thousand metric tons) | |
|---|---|---|---|
| 1 | Australia | 883,357 | |
| 2 | Brazil | 425,000 | |
| 3 | China | 360,000 | |
| 4 | India | 201,815 | |
| 5 | Russia | 94,967 | |
| 6 | South Africa | 81,068 | |
| 7 | Ukraine | 60,498 | |
| 8 | Canada | 49,009 | |
| 9 | United States | 47,900 | |
| 10 | Iran | 40,100 | |
| 11 | Kazakhstan | 39,085 | |
| 12 | Sweden | 27,200 | |
| 13 | Chile | 15,426 | |
| 14 | Mauritania | 13,300 | |
| 15 | Peru | 13,121 | |
| 16 | Mexico | 12,100 | |
| 17 | Venezuela | 12,000 | |
| 18 | Vietnam | 9,570 | |
| 19 | Mongolia | 7,695 | |
| 20 | Turkey | 6,700 | |
| 21 | North Korea | 5,250 | |
| 22 | Sierra Leone | 4,720 | |
| 23 | Malaysia | 3,920 | |
| 24 | New Zealand | 3,490 | |
| 25 | Austria | 2,800 | |
| 26 | Greece | 2,284 | |
| 27 | Liberia | 1,930 | |
| 28 | Bosnia and Herzegovina | 1,622 | |
| 29 | Colombia | 715 | |
| 30 | Algeria | 600 | |
| 31 | Pakistan | 547 | |
| 32 | Egypt | 500 | |
| 33 | South Korea | 310 | |
| 34 | Tunisia | 200 | |
| 35 | Laos | 110 | |
| 36 | Togo | 60 | |
| 37 | Bhutan | 28 | |
| 38 | Morocco | 15 | |
| 39 | Uruguay | 3 | |
| 40 | Nigeria | 2 | |
| 41 | Uganda | 2 | |
| 42 | Nepal | <0.5 | |
Source: United States Geological Survey (USGS) Minerals Resources Program
Map with the producer of iron ore in the world

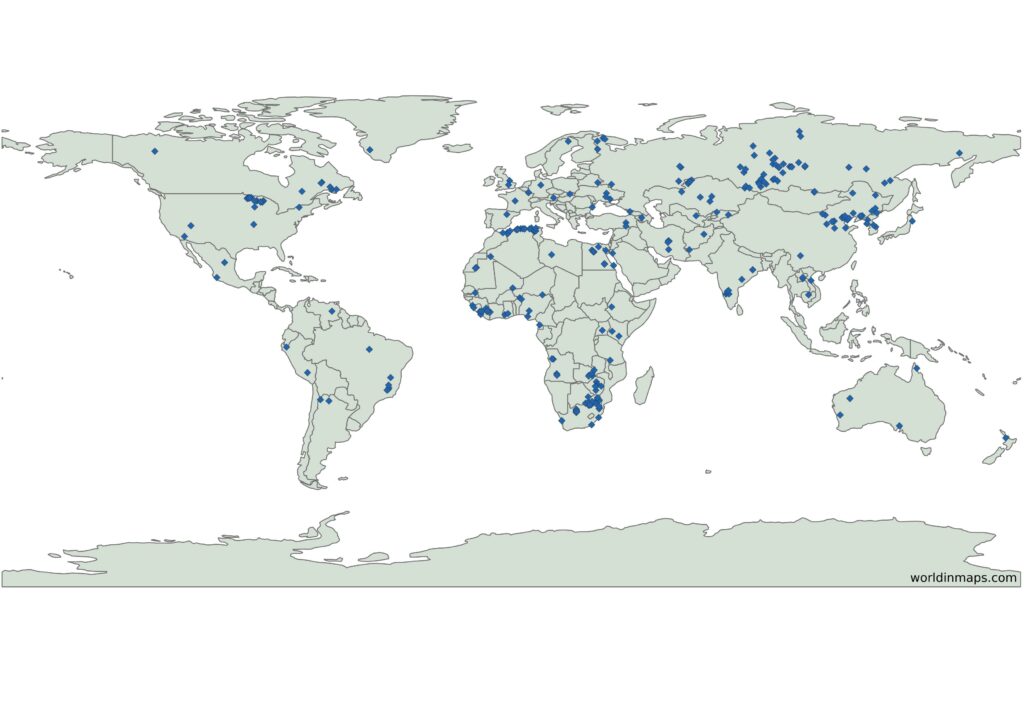
Map with the major iron deposits in the world
